
Clearwater Beach tides are small and mixed: NOAA puts the average gap between the day's higher high and lower low at 2.74 feet. For today's times, open NOAA's live page for station 8726724. For sandbars and shelling, the deepest daylight lows of the coming year are December 26 (7:34 a.m., -0.99 ft) and June 5, 2027 (7:38 p.m., -0.88 ft); this fall's best is November 27 (7:48 a.m., -0.77 ft).
Key takeaways
- Most days bring two highs and two lows of different sizes. One low is usually much lower than the other, and that's the one that uncovers sand.
- NOAA predicts 177 lows at or below 0.0 feet between October 2026 and September 2027. Only 69 of them happen between sunrise and sunset, and only 18 of those reach -0.5 feet or lower.
- From October to February the daylight lows come in the morning (7:21 to 9:54 a.m.). From March to August they come late in the day (3:58 to 8:17 p.m.). September 2027 has no low at or below zero at all.
- Predictions aren't measurements. Over the past 12 months the water at the gauge ran an average of 0.48 feet higher than predicted. A few cold, north-wind mornings in fall and winter ran more than a foot lower.
- The year's highest predicted tide is 3.70 feet (August 2, 2027), about a foot above the daily average high. Storm surge is a different scale: Hurricane Helene pushed the gauge to its record in September 2024, 8.92 feet in NOAA's verified high-low record and 9.41 feet in the six-minute readings (6.67 feet above MHHW, the figure the National Hurricane Center cites).
What is the tide at Clearwater Beach today?
This page can't show today's tide, but two NOAA pages can. Both cover the Clearwater Beach gauge, station 8726724, which NOAA has run since 1973.
- Today's predicted highs and lows: NOAA tide predictions for Clearwater Beach. Times are local (it switches between standard and daylight time for you) and heights are in feet above MLLW, explained below.
- What the water is actually doing right now: NOAA observed water levels, which plots the measured level against the prediction every six minutes.
For a sense of an ordinary day: on October 4, 2026, NOAA predicted a high of 2.98 feet at 5:32 a.m., a low of 0.40 feet at 2:06 p.m. and a high of 2.17 feet at 10:00 p.m. That's a normal fall day: the low stays well above zero, so no extra sandbar.
The next three dates worth planning around are Wednesday, October 28 (7:58 a.m., -0.46 ft), Friday, November 27 (7:48 a.m., -0.77 ft) and Saturday, December 26 (7:34 a.m., -0.99 ft, the lowest daylight low of the year). The full list is in the calendar below.
Which days have the best daylight low tides, October 2026 to September 2027?
Below is every predicted low at or below 0.0 feet MLLW that falls between sunrise and sunset at Clearwater Beach over the next 12 months. "Daylight" is tied to each date's actual sunrise and sunset rather than a clock window, since a 7:30 a.m. low is dark in January and bright in June. Heights are NOAA predictions, and real water often runs higher (see how far off predictions run).
Month by month
| Month | Lows at or below 0.0 ft (any time) | In daylight | Daylight lows at -0.5 ft or lower | Lowest daylight low |
|---|---|---|---|---|
| Oct 2026 | 5 | 3 | 0 | Oct 28, 7:58 a.m., -0.46 ft |
| Nov 2026 | 13 | 4 | 2 | Nov 27, 7:48 a.m., -0.77 ft |
| Dec 2026 | 19 | 6 | 2 | Dec 26, 7:34 a.m., -0.99 ft |
| Jan 2027 | 23 | 4 | 0 | Jan 25, 7:40 a.m., -0.48 ft |
| Feb 2027 | 27 | 1 | 0 | Feb 10, 7:22 a.m., -0.03 ft |
| Mar 2027 | 25 | 3 | 0 | Mar 23, 7:24 p.m., -0.42 ft |
| Apr 2027 | 14 | 7 | 2 | Apr 8, 7:49 p.m., -0.56 ft |
| May 2027 | 15 | 10 | 3 | May 7, 7:43 p.m., -0.77 ft |
| Jun 2027 | 16 | 12 | 3 | Jun 5, 7:38 p.m., -0.88 ft |
| Jul 2027 | 15 | 14 | 5 | Jul 3, 6:41 p.m., -0.82 ft |
| Aug 2027 | 5 | 5 | 1 | Aug 1, 6:25 p.m., -0.53 ft |
| Sep 2027 | 0 | 0 | 0 | None (lowest low of the month is +0.23 ft) |
| Total | 177 | 69 | 18 | Dec 26, 7:34 a.m., -0.99 ft |
Every daylight low at or below 0.0 ft
All 69 lows, in date order. Lows of -0.5 feet or lower (the 18 best) are in bold. Times are local, Eastern Daylight Time until November 1, 2026 and from March 14, 2027, Eastern Standard Time in between.
| Date | Low tide | Predicted height (ft, MLLW) | Sunrise to sunset |
|---|---|---|---|
| Wed, Oct 28, 2026 | 7:58 a.m. | -0.46 ft | 7:40 a.m. to 6:50 p.m. |
| Thu, Oct 29, 2026 | 8:53 a.m. | -0.37 ft | 7:40 a.m. to 6:49 p.m. |
| Fri, Oct 30, 2026 | 9:54 a.m. | -0.18 ft | 7:41 a.m. to 6:48 p.m. |
| Thu, Nov 12, 2026 | 7:21 a.m. | -0.12 ft | 6:51 a.m. to 5:40 p.m. |
| Fri, Nov 27, 2026 | 7:48 a.m. | -0.77 ft | 7:02 a.m. to 5:35 p.m. |
| Sat, Nov 28, 2026 | 8:42 a.m. | -0.50 ft | 7:03 a.m. to 5:35 p.m. |
| Sun, Nov 29, 2026 | 9:38 a.m. | -0.17 ft | 7:04 a.m. to 5:35 p.m. |
| Sat, Dec 12, 2026 | 7:43 a.m. | -0.35 ft | 7:13 a.m. to 5:37 p.m. |
| Sun, Dec 13, 2026 | 8:18 a.m. | -0.20 ft | 7:14 a.m. to 5:37 p.m. |
| Mon, Dec 14, 2026 | 8:52 a.m. | -0.02 ft | 7:14 a.m. to 5:38 p.m. |
| Sat, Dec 26, 2026 | 7:34 a.m. | -0.99 ft | 7:21 a.m. to 5:43 p.m. |
| Sun, Dec 27, 2026 | 8:18 a.m. | -0.66 ft | 7:21 a.m. to 5:44 p.m. |
| Mon, Dec 28, 2026 | 9:01 a.m. | -0.26 ft | 7:21 a.m. to 5:45 p.m. |
| Mon, Jan 11, 2027 | 7:38 a.m. | -0.36 ft | 7:24 a.m. to 5:55 p.m. |
| Tue, Jan 12, 2027 | 8:03 a.m. | -0.18 ft | 7:24 a.m. to 5:55 p.m. |
| Mon, Jan 25, 2027 | 7:40 a.m. | -0.48 ft | 7:22 a.m. to 6:06 p.m. |
| Tue, Jan 26, 2027 | 8:12 a.m. | -0.10 ft | 7:21 a.m. to 6:07 p.m. |
| Wed, Feb 10, 2027 | 7:22 a.m. | -0.03 ft | 7:13 a.m. to 6:19 p.m. |
| Tue, Mar 9, 2027 | 6:21 p.m. | -0.11 ft | 6:48 a.m. to 6:36 p.m. |
| Mon, Mar 22, 2027 | 6:42 p.m. | -0.27 ft | 7:33 a.m. to 7:44 p.m. |
| Tue, Mar 23, 2027 | 7:24 p.m. | -0.42 ft | 7:32 a.m. to 7:44 p.m. |
| Tue, Apr 6, 2027 | 6:30 p.m. | -0.21 ft | 7:16 a.m. to 7:52 p.m. |
| Wed, Apr 7, 2027 | 7:07 p.m. | -0.43 ft | 7:15 a.m. to 7:52 p.m. |
| Thu, Apr 8, 2027 | 7:49 p.m. | -0.56 ft | 7:14 a.m. to 7:53 p.m. |
| Mon, Apr 19, 2027 | 5:50 p.m. | -0.22 ft | 7:03 a.m. to 7:59 p.m. |
| Tue, Apr 20, 2027 | 6:30 p.m. | -0.43 ft | 7:02 a.m. to 7:59 p.m. |
| Wed, Apr 21, 2027 | 7:10 p.m. | -0.52 ft | 7:01 a.m. to 8:00 p.m. |
| Thu, Apr 22, 2027 | 7:49 p.m. | -0.49 ft | 7:00 a.m. to 8:00 p.m. |
| Tue, May 4, 2027 | 5:34 p.m. | -0.18 ft | 6:49 a.m. to 8:07 p.m. |
| Wed, May 5, 2027 | 6:15 p.m. | -0.48 ft | 6:48 a.m. to 8:08 p.m. |
| Thu, May 6, 2027 | 6:57 p.m. | -0.69 ft | 6:48 a.m. to 8:09 p.m. |
| Fri, May 7, 2027 | 7:43 p.m. | -0.77 ft | 6:47 a.m. to 8:09 p.m. |
| Mon, May 17, 2027 | 4:55 p.m. | -0.09 ft | 6:41 a.m. to 8:15 p.m. |
| Tue, May 18, 2027 | 5:39 p.m. | -0.33 ft | 6:40 a.m. to 8:16 p.m. |
| Wed, May 19, 2027 | 6:19 p.m. | -0.47 ft | 6:40 a.m. to 8:16 p.m. |
| Thu, May 20, 2027 | 6:58 p.m. | -0.50 ft | 6:39 a.m. to 8:17 p.m. |
| Fri, May 21, 2027 | 7:37 p.m. | -0.45 ft | 6:39 a.m. to 8:17 p.m. |
| Sat, May 22, 2027 | 8:17 p.m. | -0.33 ft | 6:38 a.m. to 8:18 p.m. |
| Tue, Jun 1, 2027 | 4:31 p.m. | -0.04 ft | 6:35 a.m. to 8:23 p.m. |
| Wed, Jun 2, 2027 | 5:18 p.m. | -0.40 ft | 6:35 a.m. to 8:24 p.m. |
| Thu, Jun 3, 2027 | 6:04 p.m. | -0.68 ft | 6:35 a.m. to 8:24 p.m. |
| Fri, Jun 4, 2027 | 6:50 p.m. | -0.84 ft | 6:35 a.m. to 8:25 p.m. |
| Sat, Jun 5, 2027 | 7:38 p.m. | -0.88 ft | 6:35 a.m. to 8:25 p.m. |
| Tue, Jun 15, 2027 | 4:45 p.m. | -0.14 ft | 6:35 a.m. to 8:29 p.m. |
| Wed, Jun 16, 2027 | 5:30 p.m. | -0.30 ft | 6:35 a.m. to 8:29 p.m. |
| Thu, Jun 17, 2027 | 6:10 p.m. | -0.38 ft | 6:35 a.m. to 8:30 p.m. |
| Fri, Jun 18, 2027 | 6:48 p.m. | -0.39 ft | 6:35 a.m. to 8:30 p.m. |
| Sat, Jun 19, 2027 | 7:25 p.m. | -0.33 ft | 6:35 a.m. to 8:30 p.m. |
| Sun, Jun 20, 2027 | 8:01 p.m. | -0.23 ft | 6:35 a.m. to 8:30 p.m. |
| Wed, Jun 30, 2027 | 4:12 p.m. | -0.17 ft | 6:38 a.m. to 8:32 p.m. |
| Thu, Jul 1, 2027 | 5:05 p.m. | -0.49 ft | 6:39 a.m. to 8:32 p.m. |
| Fri, Jul 2, 2027 | 5:55 p.m. | -0.72 ft | 6:39 a.m. to 8:32 p.m. |
| Sat, Jul 3, 2027 | 6:41 p.m. | -0.82 ft | 6:39 a.m. to 8:32 p.m. |
| Sun, Jul 4, 2027 | 7:27 p.m. | -0.78 ft | 6:40 a.m. to 8:32 p.m. |
| Mon, Jul 5, 2027 | 8:11 p.m. | -0.60 ft | 6:40 a.m. to 8:32 p.m. |
| Wed, Jul 14, 2027 | 4:35 p.m. | -0.003 ft | 6:44 a.m. to 8:30 p.m. |
| Thu, Jul 15, 2027 | 5:21 p.m. | -0.11 ft | 6:45 a.m. to 8:30 p.m. |
| Fri, Jul 16, 2027 | 6:00 p.m. | -0.16 ft | 6:45 a.m. to 8:29 p.m. |
| Sat, Jul 17, 2027 | 6:34 p.m. | -0.15 ft | 6:46 a.m. to 8:29 p.m. |
| Sun, Jul 18, 2027 | 7:06 p.m. | -0.10 ft | 6:46 a.m. to 8:29 p.m. |
| Mon, Jul 19, 2027 | 7:36 p.m. | -0.004 ft | 6:47 a.m. to 8:28 p.m. |
| Thu, Jul 29, 2027 | 3:58 p.m. | -0.12 ft | 6:52 a.m. to 8:23 p.m. |
| Fri, Jul 30, 2027 | 4:53 p.m. | -0.37 ft | 6:53 a.m. to 8:22 p.m. |
| Sat, Jul 31, 2027 | 5:41 p.m. | -0.52 ft | 6:53 a.m. to 8:22 p.m. |
| Sun, Aug 1, 2027 | 6:25 p.m. | -0.53 ft | 6:54 a.m. to 8:21 p.m. |
| Mon, Aug 2, 2027 | 7:05 p.m. | -0.39 ft | 6:54 a.m. to 8:20 p.m. |
| Tue, Aug 3, 2027 | 7:44 p.m. | -0.14 ft | 6:55 a.m. to 8:20 p.m. |
| Sat, Aug 28, 2027 | 4:34 p.m. | -0.07 ft | 7:08 a.m. to 7:57 p.m. |
| Sun, Aug 29, 2027 | 5:19 p.m. | -0.09 ft | 7:08 a.m. to 7:56 p.m. |
Some near misses are worth knowing. The deepest low of the year, -1.33 feet, comes at 5:05 a.m. on January 21, 2027, about two hours before sunrise. Thanksgiving morning, November 26, has a -0.93 foot low at 6:55 a.m., seven minutes before sunrise. It misses the table on a technicality, and the sand will still be out at first light, a good start to Thanksgiving week at the beach. June 6, 2027 has a -0.78 foot low at 8:27 p.m., one minute after sunset. In town for the Fourth? The July 4, 2027 low is -0.78 feet at 7:27 p.m., about an hour before sunset, and our Fourth of July guide covers the rest of the evening.
The best runs follow the moon. Every daylight low at -0.5 feet or lower falls within four days of a new or full moon (U.S. Naval Observatory phase dates). Within a run, the low arrives roughly 25 minutes to an hour later each day. If your trip misses the bold dates, check the days on either side of them.
We downloaded NOAA CO-OPS high and low tide predictions for station 8726724, Clearwater Beach (datum MLLW, local standard/daylight time, feet) for October 1, 2026 through September 30, 2027 from the NOAA data API, retrieved October 4, 2026. Heights are relative to Mean Lower Low Water on NOAA's 1983-2001 National Tidal Datum Epoch. For each date we calculated sunrise and sunset at 27.978° N, 82.828° W with the equations behind the NOAA Solar Calculator, and kept every low at or below 0.0 feet from sunrise to sunset inclusive, to the minute. Spot checks against the U.S. Naval Observatory API on 11 dates matched to the minute, except one sunset that was a minute apart, which changed no rows. Any row can be re-checked on NOAA's prediction page for the station.
Why does Clearwater get one big low and one small one?
NOAA classifies the Clearwater Beach gauge as a mixed tide. Its tides tutorial defines that as two highs and two lows of different sizes every lunar day. A lunar day runs 24 hours and 50 minutes, so the tide shows up roughly 50 minutes later each day.
Here the mix is lopsided. In NOAA's harmonic constants for the station, the main twice-a-day lunar component (M2) has an amplitude of 0.80 feet, but the two main once-a-day components (K1 and O1) add up to almost a foot on their own (0.51 and 0.48 feet). With a strong once-a-day part, the day's two lows split into a deep one and a shallow one. Sometimes the shallow one barely happens: in the 12 months of predictions we pulled, 51 days had only one low.
Take October 5, 2026. NOAA predicts a low of 2.02 feet at 1:28 a.m. and a low of 0.43 feet at 3:05 p.m. The first is just a pause during a high-water night. The second is the real low. On any chart, find the lower of the two lows and ignore the other.
The total swing is small. NOAA's tidal datums put the mean range (average high to average low) at 1.89 feet and the great diurnal range (average higher high to average lower low) at 2.74 feet. On a beach with that little range, a low of -0.5 feet (half a foot under the average lower low) is a big day.
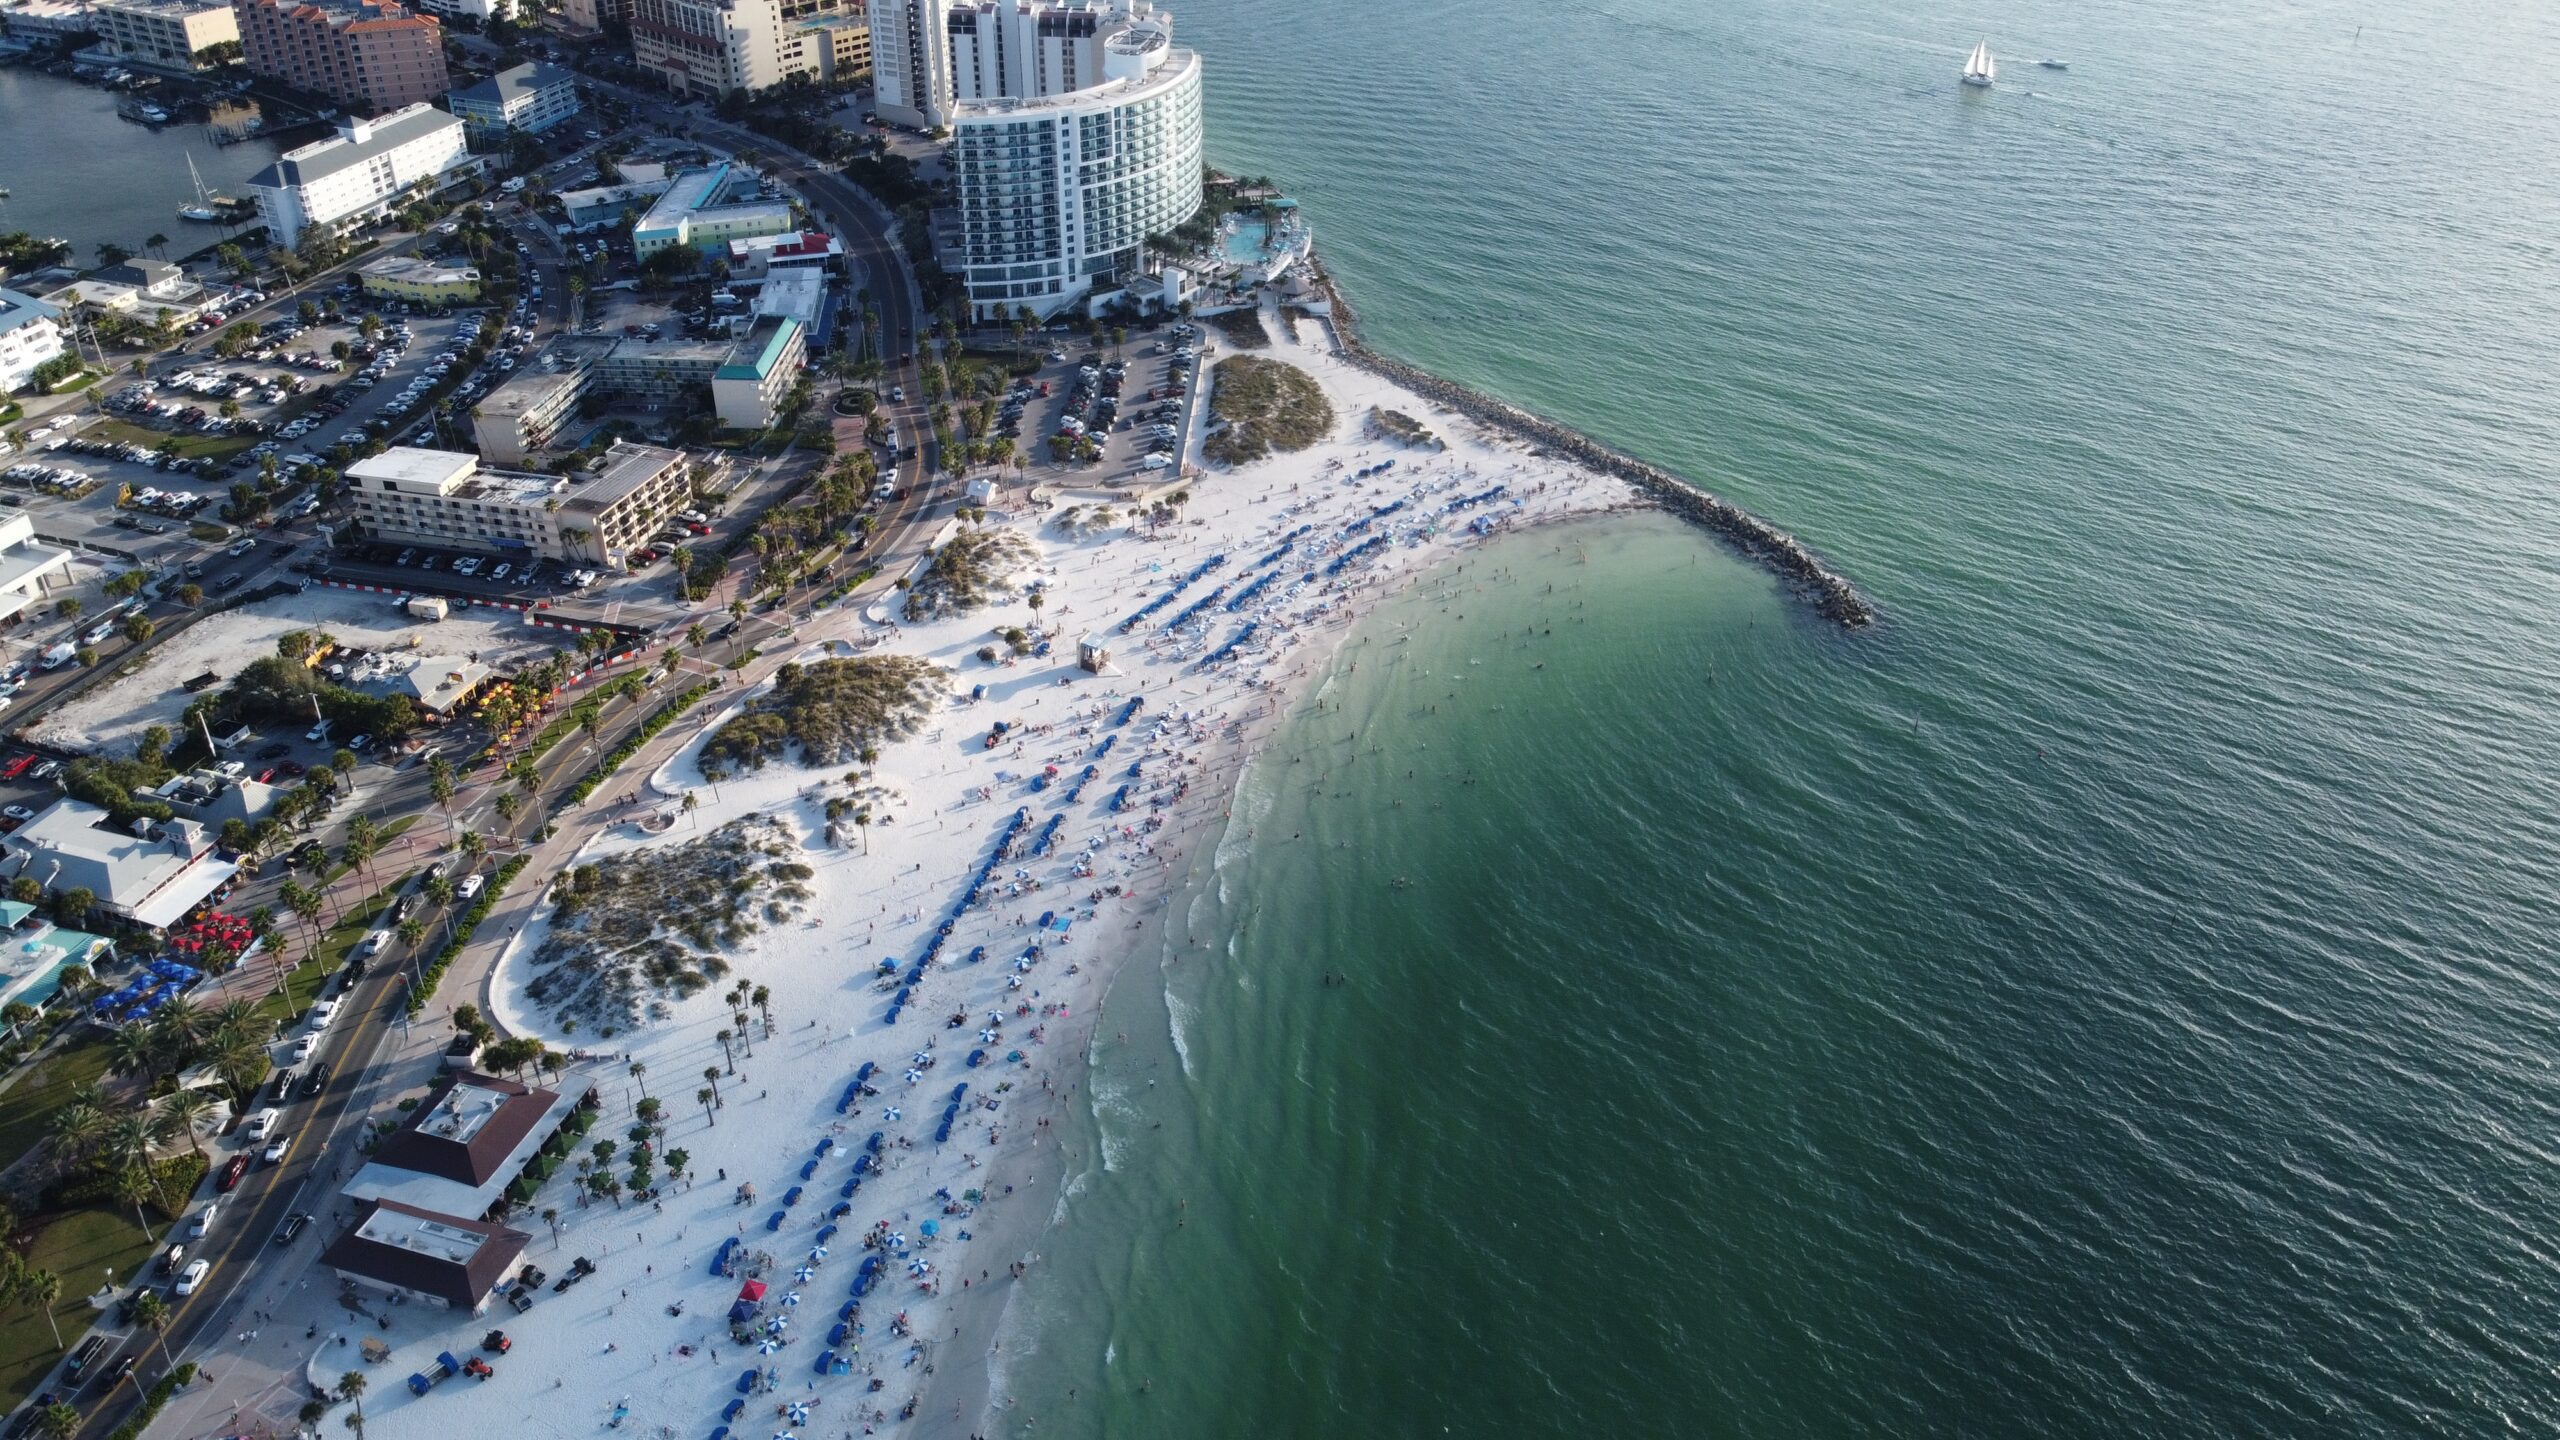
How do you read a NOAA tide chart for Clearwater Beach?
Most confusion comes from the zero line, negative numbers and the gap between a prediction and a measurement. Time zones, at least, are handled for you.
- Zero is not sea level. NOAA's heights are measured from Mean Lower Low Water (MLLW), the average of each day's lower low tide over the 1983-2001 datum epoch. A 0.0 foot low is an ordinary lower low.
- Negative tides are lows below that average. A -0.8 foot low is 0.8 feet lower than a typical lower low, which on this beach exposes extra sand at the waterline and on the shallow bars.
- Predictions don't include weather. NOAA's tutorial says strong offshore winds can push water away from the coast and exaggerate low tides, while onshore winds can pile water up and "virtually" eliminate them. High pressure tends to depress sea level, and low pressure tends to bring tides higher than predicted.
- Times are local. NOAA's prediction page defaults to local standard or daylight time (LST/LDT), so you don't have to convert.
The station's full scale, from NOAA's datum sheet, converted to feet above MLLW to match the chart:
| NOAA level, station 8726724 | Feet above MLLW | What it means |
|---|---|---|
| Highest observed (Hurricane Helene, Sept 26-27, 2024) | 8.92 | The gauge's record, a storm surge, not a tide |
| Highest astronomical tide (HAT) | 3.70 | The highest tide NOAA predicts over a 40-year window |
| Mean higher high water (MHHW) | 2.74 | The average of each day's higher high |
| Mean high water (MHW) | 2.40 | The average of all highs |
| Mean sea level (MSL) | 1.47 | The 1983-2001 average water level |
| Mean low water (MLW) | 0.51 | The average of all lows |
| Mean lower low water (MLLW) | 0.00 | The chart's zero line |
| Lowest astronomical tide (LAT) | -1.39 | The lowest tide NOAA predicts over a 40-year window |
| Lowest observed (Jan 19, 1977) | -2.57 | The gauge's record low, tide plus weather |
NOAA lists the datum epoch as 1983-2001 and the current datums as accepted on May 13, 2020.
Why are winter's best lows in the morning and summer's at dinnertime?
Scan the calendar and the split is obvious. Every daylight low from October through February falls between 7:21 and 9:54 a.m. Every one from March through August falls between 3:58 and 8:17 p.m. The deep lower low drifts around the clock with the seasons.
Late winter has the most negative lows of all: 27 in February 2027 and 25 in March, against 15 or 16 in May, June or July. Most of them land in the dark before sunrise, though, so February gets just one in daylight, and it's barely negative (-0.03 feet). In summer the deep lows come in the evening with the sun still up, which puts 14 of July's 15 negative lows in daylight.
So there are two plans. From late fall through winter, go early: be on the sand around sunrise, and the low is usually within an hour or two. In spring and summer, plan a late-afternoon walk that runs into sunset; our tips on planning a summer evening around storms and low tide help with timing. Our sunset times by month table helps you see how much light you'll have after the low.
How far off are the predictions on a real day?
Often by more than the difference between a good low and an ordinary one. We compared NOAA's hourly predictions with the gauge's hourly measurements for October 2025 through September 2026: 8,760 hours, using NOAA verified data plus preliminary data for the most recent months, grouped by calendar month in UTC.
| Month | Average observed minus predicted | Hours more than 0.5 ft below prediction | Hours more than 0.5 ft above prediction |
|---|---|---|---|
| Oct 2025 | +0.59 ft | 0% | 59% |
| Nov 2025 | +0.31 ft | 6% | 35% |
| Dec 2025 | +0.38 ft | 1% | 37% |
| Jan 2026 | +0.25 ft | 8% | 33% |
| Feb 2026 | +0.43 ft | 7% | 56% |
| Mar 2026 | +0.47 ft | 3% | 58% |
| Apr 2026 | +0.60 ft | 0% | 71% |
| May 2026 | +0.70 ft | 0% | 82% |
| Jun 2026 | +0.52 ft | 0% | 54% |
| Jul 2026 | +0.63 ft | 0% | 69% |
| Aug 2026 | +0.39 ft | 0% | 24% |
| Sep 2026 | +0.45 ft | 0% | 33% |
| 12 months | +0.48 ft |
The water ran higher than predicted almost all year, by about half a foot on average. That's consistent with NOAA's long-term trend for this gauge, a rise of 1.72 inches per decade since 1973. The datums are pinned to the middle of the 1983-2001 epoch, and three-plus decades at that rate adds up to roughly half a foot. In practice, a predicted -0.5 foot summer evening low often behaves more like a zero.
The misses in the other direction all fall between November and March, and they're big. On November 11, 2025, NOAA predicted 0.26 feet at 11 a.m. and the gauge read -0.89 feet, more than a foot lower. On February 1, 2026, the verified six-minute reading at 6:18 a.m. was -2.46 feet, within about a tenth of a foot of the station's 1977 record low; NOAA had predicted about -1.08 feet for that hour, and at 8 a.m., after sunrise, the gauge still read -1.59 feet against a prediction of -0.16. Weather observations from St. Pete-Clearwater International Airport for both mornings show northerly winds (northwest to northeast), high pressure (about 1,023 to 1,030 millibars) and dawn temperatures in the 30s. NOAA's tutorial ties high pressure to exceptionally low tides and says wind that moves water away from the coast exaggerates them, and mornings like these are when you can expect the most sand to show.
The calendar shows predictions. On the day, open NOAA's observed water level page and compare the measured line with the predicted one. If the measured line sits above it (common in spring and summer), expect less exposed sand than the calendar suggests. If it's running below on a cold, windy winter morning, you may get a better low than anything in the table. Dress for it: both examples above dawned in the 30s at the airport.
What tide is best for shelling, wading, kayaking and fishing?
Some plans hinge on the tide and some barely care. Where a row reflects general practice rather than an official rule, it says so.
| Plan | Best tide state | Why, and what to watch |
|---|---|---|
| Shelling on the beach | Around a low, ideally a negative one | A low uncovers more of the shoreline. Cold, north-wind winter mornings are the strongest case (see above). Where to go and what you'll find is in our shelling guide; use this calendar for the timing. |
| Wading out to sandbars | Falling tide into the low | More bar is exposed near the low. The National Weather Service says rip currents on beaches with small tidal ranges often flow faster about an hour or two either side of low tide, when breaking waves peak. Swim near a lifeguard and check the flag first. |
| Boating to Three Rooker Island | Arrive on a rising or high tide | The opposite of shelling. It's shallow, and a boat beached at high water can be left aground as the tide drops (basic boating sense, not an official rule). Our Three Rooker Island guide has the details, and our guide to renting a pontoon covers getting a boat; use the calendar to see which lows to avoid. |
| Kayaking mangroves and shallow flats | Mid to high tide | More water means less dragging over shallows. That's general paddling sense rather than a rule, so ask your outfitter about the route. The kayaking guide lists launch points. |
| Fishing from Pier 60 or inshore | Moving water, either direction | The usual rule of thumb favors an incoming or outgoing tide over slack water, since moving water carries bait. It's a habit, not a guarantee. The Pier 60 fishing guide covers rules and rigs, and the same tide timing applies at the other fishing piers nearby. |
| Caladesi Island by ferry | Any tide for the beach | The ferry operator says Caladesi's beaches are "accessible only by boat." For shelling there, pair your trip with a low from the calendar; the Caladesi Island guide covers the ferry. |
Does Clearwater Beach get king tides or tidal flooding?
"King tide" isn't a scientific term. NOAA describes it as a name people use for exceptionally high tides, which tend to come around new and full moons and when the moon is closest to Earth. At Clearwater Beach the highest predicted tides of the coming year cluster in summer: 3.60 feet at 11:47 a.m. on July 4, 2027, then 3.70 feet at 11:50 a.m. on August 2 (the year's peak), and 3.65 feet at 11:00 a.m. on August 30. The August 2 peak matches NOAA's highest astronomical tide for the station.
On paper, 3.70 feet MLLW is only about a foot above the average higher high. But the National Weather Service's impact notes for this gauge say roads on the north end of the island begin to flood at 1.0 foot above MHHW. Add the half foot the water has been running above predictions, and those late-summer midday highs are the ones to watch. How they compare with the official flood levels and the storm record:
| Level at the Clearwater Beach gauge | Feet above MHHW | Feet above MLLW (chart scale) |
|---|---|---|
| Year's highest predicted tide, Aug 2, 2027 | 0.96 | 3.70 |
| NWS impact note: roads on the north end begin to flood | 1.0 | 3.74 |
| NWS action stage | 2.0 | 4.74 |
| NWS minor flooding (beaches flooded, water up to homes on the north end) | 2.7 | 5.44 |
| NWS moderate flooding | 4.0 | 6.74 |
| NWS major flooding | 6.0 | 8.74 |
| Hurricane Helene, NOAA verified high, Sept 26, 2024 | 6.18 | 8.92 |
The National Weather Service publishes its flood categories for this gauge in feet above MHHW; we added 2.74 feet (NOAA's MHHW above MLLW) to put them on the chart scale. NOAA's verified high-low record puts Helene's peak at 8.92 feet at 9:24 p.m. on September 26, 2024; the six-minute readings went higher, to 9.41 feet MLLW at 11 p.m. Storm surge is a hurricane-planning question, not a tide-table one: see our hurricane season guide, and for flood warnings follow the National Weather Service in Tampa Bay.
Every tide time and height on this page comes from NOAA CO-OPS data for station 8726724, downloaded October 4, 2026: predictions, verified and preliminary water levels, tidal datums, harmonic constants and the sea level trend. Sunrise and sunset come from NOAA's solar equations, cross-checked with the U.S. Naval Observatory, and moon phases from the Naval Observatory. Flood categories and impact notes are from the National Weather Service's gauge page (CWBF1), and airport weather from the Iowa Environmental Mesonet's archive of official observations. We didn't measure, walk or time any tides ourselves. We're an independent guide, and nobody named here pays us.
Frequently asked questions
When is low tide at Clearwater Beach today?
Check NOAA's prediction page for station 8726724. It lists the day's highs and lows in local time. Look for the lower of the two lows; on many days it's the only one that matters.
How big are the tides at Clearwater Beach?
Small. NOAA's datums put the average range at 1.89 feet and the average gap between the day's higher high and lower low at 2.74 feet. The highest predicted tide from October 2026 to September 2027 is 3.70 feet and the lowest is -1.33 feet.
What does a negative tide mean?
A low below Mean Lower Low Water, the chart's zero line. A -0.8 foot low is 0.8 feet lower than an average lower low, so more sand and sandbar show.
Can you walk to Caladesi Island at low tide?
Don't plan on it. We found no official source that describes a walking route from Clearwater Beach to Caladesi Island State Park, at low tide or any other time, and the ferry operator says the island's beaches are "accessible only by boat." Our Caladesi Island guide covers getting there by ferry.
Does the tide affect waves or rip currents?
Yes. The National Weather Service says the tide affects how much waves break, which drives rip currents. On beaches with smaller tidal ranges, it says rips often flow faster about an hour or two either side of low tide and may stop flowing around high tide.
Do tides at Clearwater Beach ever flood the island?
Normal tides don't reach the National Weather Service's flood stages for the gauge, but its impact notes say north-end roads start to flood at 1.0 foot above average higher high water, about 3.74 feet on the chart scale. The year's highest predicted tide is 3.70 feet, and with the water running about half a foot above predictions lately, the biggest late-summer highs could reach that line. Serious flooding comes with storms.
Sources
- NOAA CO-OPS, Clearwater Beach station 8726724 home page (station type, established 1973). tidesandcurrents.noaa.gov
- NOAA CO-OPS, tide predictions for station 8726724 (hilo, MLLW, local time), October 2026 to September 2027, retrieved October 4, 2026. tidesandcurrents.noaa.gov
- NOAA CO-OPS, observed water levels and hourly predictions for station 8726724, October 2025 to September 2026, and six-minute data for September 26-27, 2024 and February 1, 2026. tidesandcurrents.noaa.gov
- NOAA CO-OPS, tidal datums for station 8726724 (1983-2001 epoch, accepted May 13, 2020; highest and lowest observed). tidesandcurrents.noaa.gov
- NOAA CO-OPS, tidal datum definitions. tidesandcurrents.noaa.gov
- NOAA CO-OPS, relative sea level trend for station 8726724 (1.72 inches per decade, 1973 to 2025). tidesandcurrents.noaa.gov
- NOAA National Ocean Service, Tides and Water Levels tutorial: the lunar day (tides05), types of tidal cycles (tides07) and what else affects tides (tides08). oceanservice.noaa.gov
- NOAA National Ocean Service, What is a King Tide? oceanservice.noaa.gov
- National Weather Service, Clearwater Beach gauge CWBF1 (flood categories and impact notes, in feet above MHHW). water.noaa.gov
- National Weather Service, Rip Current Science (tides, rip currents and sandbars). weather.gov
- NOAA Global Monitoring Laboratory, Solar Calculator and solar position equations. gml.noaa.gov
- U.S. Naval Observatory, Astronomical Applications API (sunrise and sunset checks, moon phases). aa.usno.navy.mil
- Iowa Environmental Mesonet, ASOS archive for St. Pete-Clearwater International Airport (PIE), November 11, 2025 and February 1, 2026. mesonet.agron.iastate.edu
- Caladesi Island Ferry, home page (Caladesi's beaches "accessible only by boat"). caladesiferry.org
Planning a low-tide morning or evening?
Pick your date from the calendar, then plan the rest of the day around it.
Plan your visit