
Mostly natural. Clearwater Beach Island is a natural barrier island, and state records map no sand placement on its 3-mile Gulf front, only small fills near Clearwater Pass (1951, 2017, 2022). Island Estates, across Mandalay Channel, is built land. The beach that gets topped up is Sand Key, south of the pass: sand placed five times since 1998, the latest in fall 2025 with sand dredged from Egmont shoals at the mouth of Tampa Bay. None of it came from Mexico.
Key takeaways
- The Gulf beach from the north end of Clearwater Beach Island to just past Pier 60 has no mapped sand placement in FDEP's records and isn't on the state's June 2026 eroding-beach list. One caveat: around 1949 a city project pumped about 50,000 cubic yards from the bay onto the beach, at a spot the record doesn't give.
- Island Estates is built land. The 1943 USGS map shows open water and two mangrove islands there. The 1974 edition, drawn from December 1971 aerial photos, shows finger islands with streets.
- The $125.7 million project whose schedule ended in February 2026 was paid for by Pinellas County, not the Army Corps. It placed sand on Sand Key, Treasure Island and Upham Beach, and none on Clearwater Beach Island north of the pass.
- Every named sand source in the Clearwater-area records is close by: Clearwater Pass, the bay, the Intracoastal Waterway, the Egmont shoals and an offshore borrow area 12 to 15 miles west of Sand Key, plus small amounts of unspecified "upland" sand. We found no document of sand brought in from Mexico or anywhere abroad.
- The white comes from fine quartz. USGS shelf studies describe the nearshore seafloor here as mostly quartz sand, probably reworked from older Florida deposits, mixed with crushed shell from local sea life.
- On May 29, 2026, Pinellas County and the Army Corps signed an amendment that loosens the easement rules the county had been trying to change since 2015. Those rules are why the 2025 project got no federal money.
Is Clearwater Beach natural or man-made?
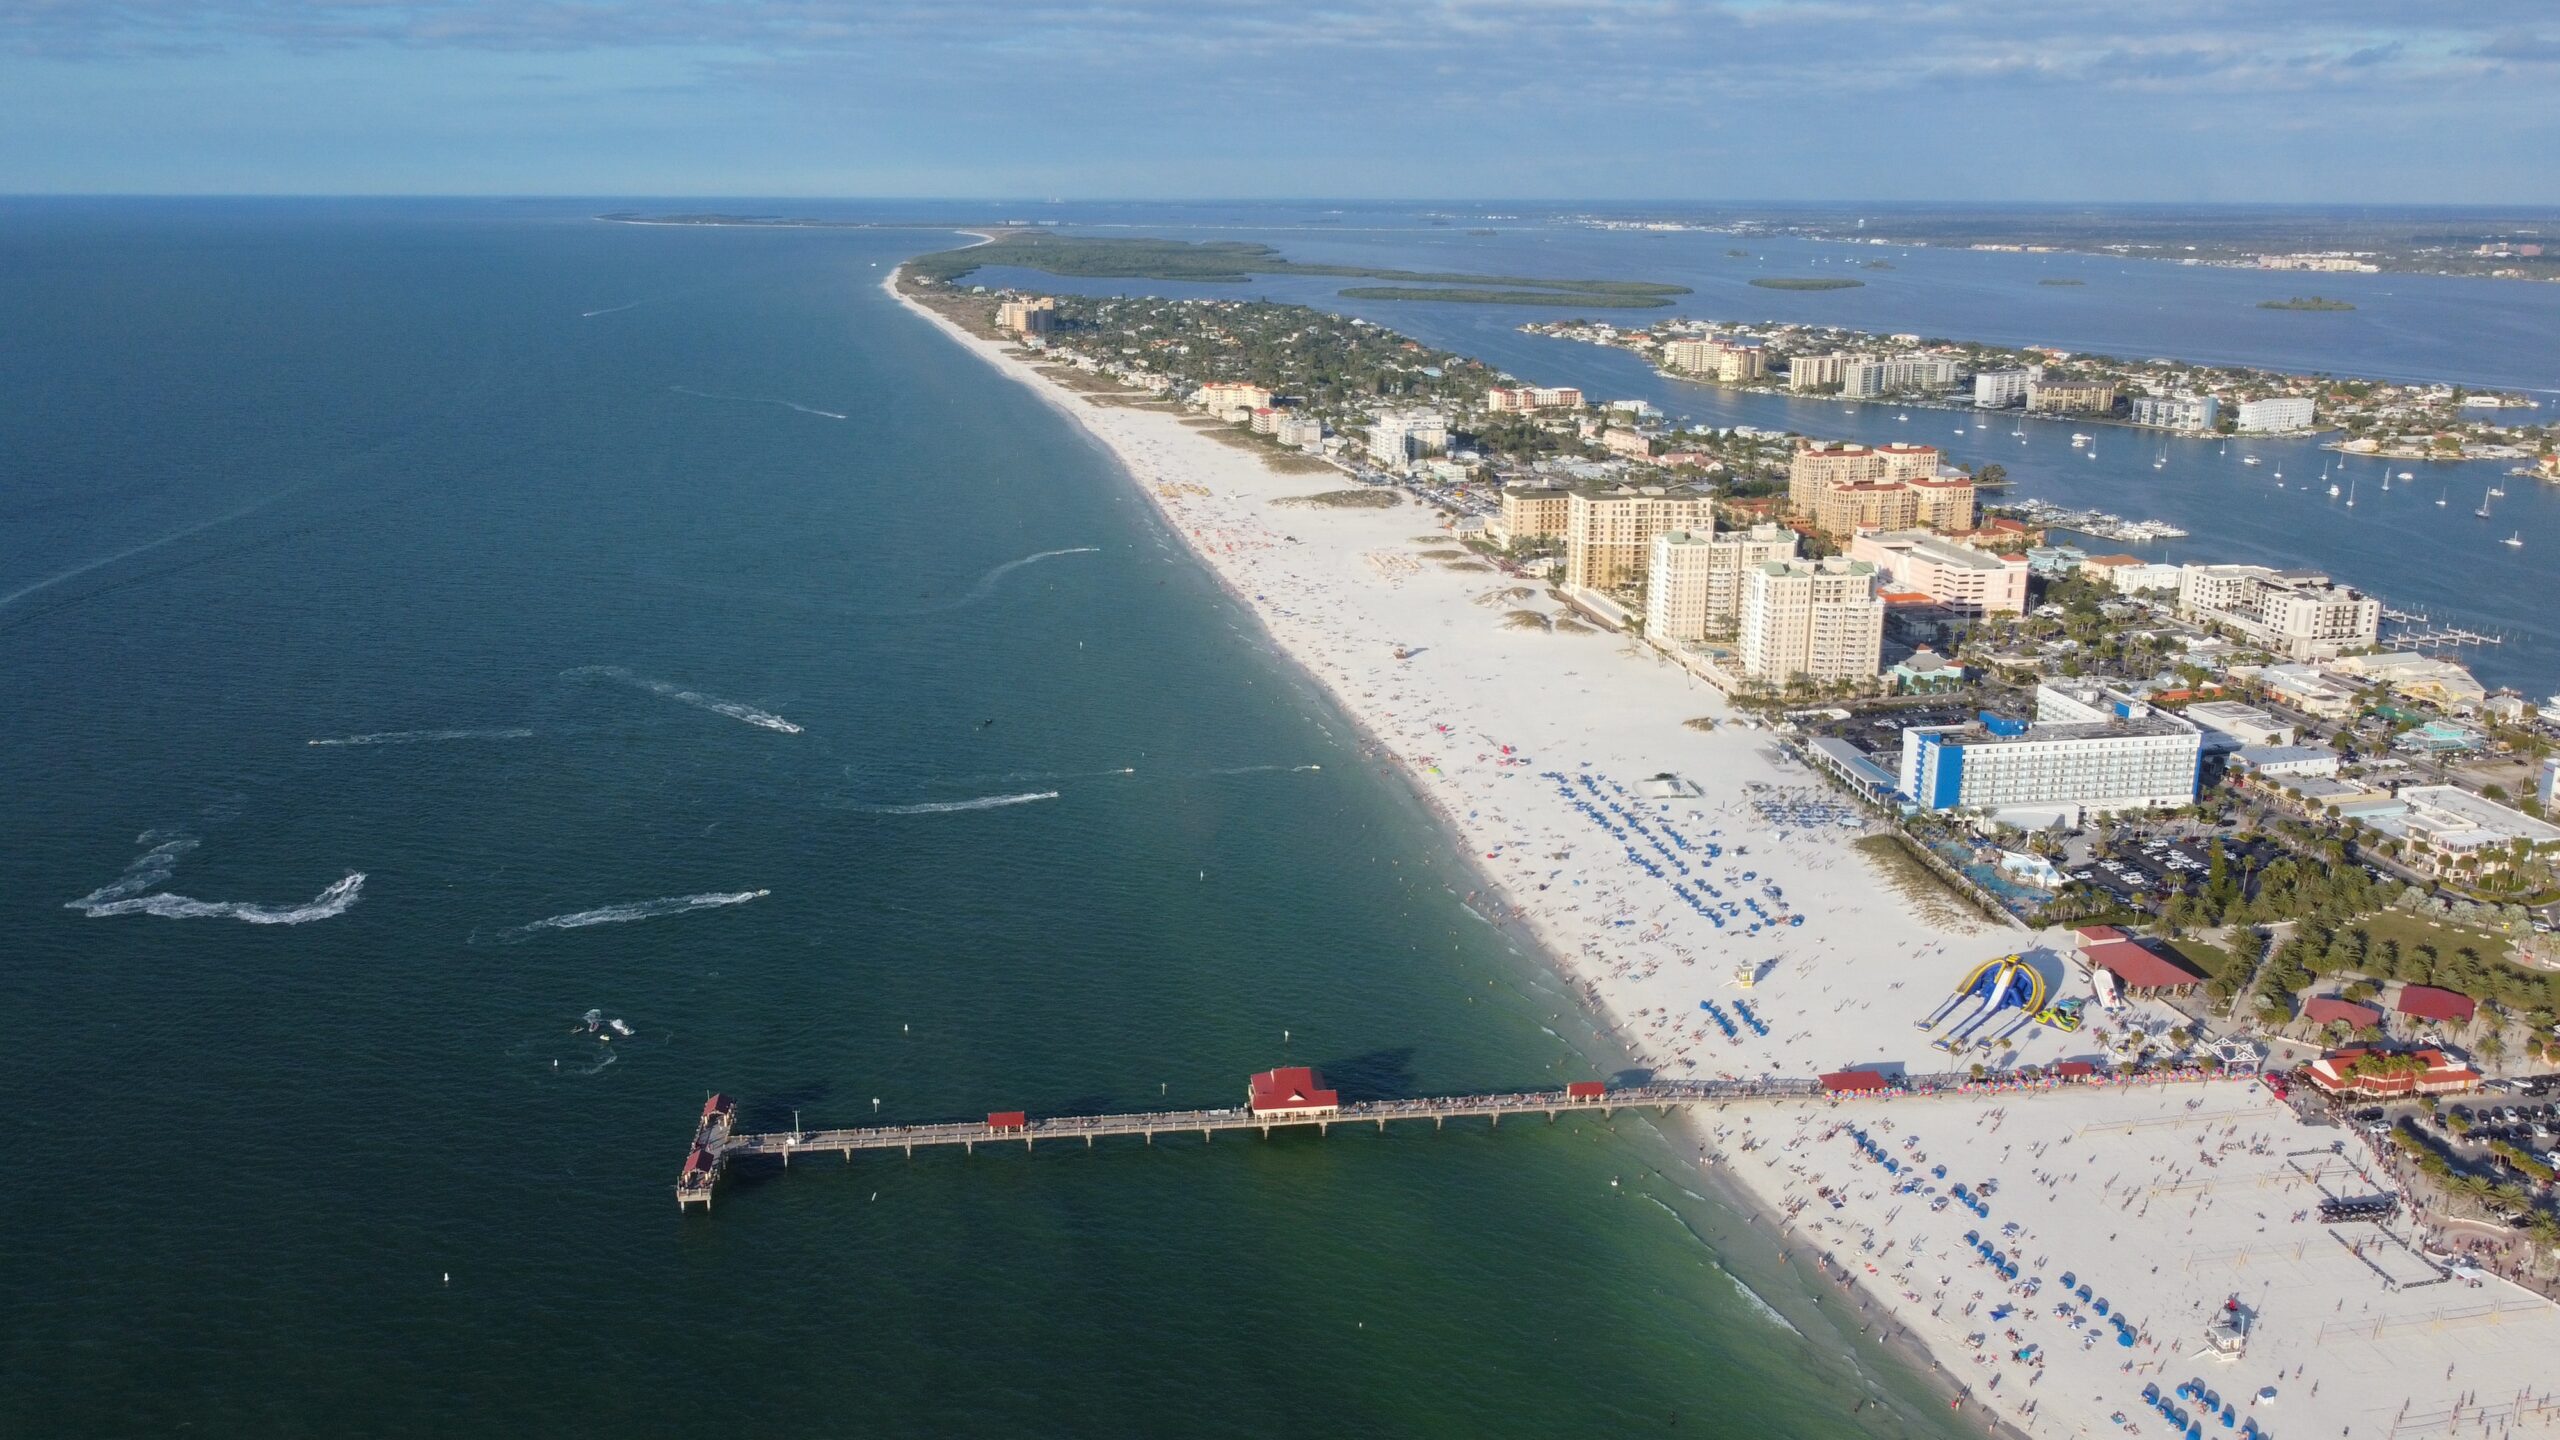
The beach itself is natural. Clearwater Beach Island is one of the barrier islands that line the Pinellas County coast. Florida's Department of Environmental Protection (FDEP) describes it as about three miles long, between Caladesi Island to the north and Sand Key to the south. Dunedin Pass once separated it from Caladesi, and FDEP now lists that pass as closed. The island shows up, beach and all, on the oldest detailed federal map we checked, the 1943 USGS Clearwater quadrangle.
"Man-made" does fit two other things. One is land: Island Estates and parts of the bay shore were built up out of Clearwater Harbor in the 1900s, Island Estates sometime between 1943 and 1971. The other is sand: Sand Key, the next island south, has had millions of cubic yards pumped onto it since the late 1970s. Most of the confusion comes from mixing these up. Official documents don't help, because state and county records sometimes call the City of Clearwater's stretch of Sand Key "Clearwater Beach" too.
The answer splits three ways. The Gulf front of Clearwater Beach Island is natural. Island Estates and parts of the bay shore are fill. Sand Key, starting at Sand Key Park, is nourished. The map and table below show where each one starts and stops.
Which parts are natural, built or nourished?
The line on this map traces the Gulf shoreline through FDEP's survey monuments, the numbered "R-monuments" spaced roughly 1,000 feet apart that the state uses to locate every beach project. Color shows what the records say happened to each stretch, and the numbers match the table under it.
| # | Segment (FDEP monuments) | Verdict | What the record shows | Latest recorded sand |
|---|---|---|---|---|
| 1 | Clearwater Beach Island Gulf front, north end to just south of Pier 60 (R30 to R46, about 3 mi) | Natural | Barrier-island beach. No mapped sand placement in FDEP's database or its 2026 beach plan. Not on FDEP's June 2026 eroding-beach list. Caveat: a city project around 1949 pumped about 50,000 cu yd from the bay onto city-owned beach, exact location not recorded. | None mapped |
| 2 | South curve and Clearwater Pass north shore (R46 to R50, about 0.8 mi) | Small fills, mostly walled | 150,000 cu yd on the southwest curve in 1951; 3,200 cu yd between new groins in 2017; about 18,300 cu yd with three rock T-groins in 2022. FDEP lists R47 to R49 as critically eroded inlet shoreline, mostly lined with concrete bulkheads. | February 2022 |
| 3 | Island Estates, plus bay-side fingers off the island south of the causeway | Built land (fill) | Open water and two mangrove islands (Big Mangrove Key, Pasadees Key) on the 1943 USGS map; finger islands with streets (Island Way, Midway Island, Snug Island) on the 1974 edition, which was drawn from December 1971 aerial photos. The island's bay-side fingers already appear in 1943 and are longer by 1974. Not a beach. | Not applicable |
| 4 | North end of Sand Key, around Sand Key Park (R51 to R55, about 0.8 mi) | Built up with inlet sand | From 1981 to mid-1984 the City of Clearwater dredged Clearwater Pass with its own dredge and placed nearly 1 million cu yd on R51 to R60. About 7,000 cu yd of Intracoastal Waterway sand was trucked to the park in 1994. | 1994 |
| 5 | Sand Key, Clearwater to Belleair Beach (R55 to R66, about 2.1 mi) | Nourished | Federal project placements in 1998 to 1999 (FDEP says this stretch was restored in 1998), 2006, 2012 and 2018; county-funded emergency placement in fall 2025. | October to early November 2025 (county updates) |
| 6 | Belleair Shore (R66 to R71, about 0.9 mi) | Skipped | FDEP names Belleair Shore as one of the Sand Key areas where no restoration or nourishment has been done, and its placements run around it. | None recorded |
We downloaded FDEP's Coastal Range Monuments layer to plot each R-monument (Pier 60 sits at R44). We then pulled every Pinellas record from FDEP's Sand Placement Events layer (1951 to 2021) and assigned each one to a segment by its monument range. Events that appear only in the text of FDEP's Strategic Beach Management Plan, Southwest Gulf Coast Region (August 2026, pages 4 to 7) or in Pinellas County's project pages were added by hand, with the page cited. Segment boundaries follow FDEP's own labels in its 2025 hurricane report: "Clearwater Beach" R30 to R46 and "Clearwater Pass" R46 to R50. Built land comes from comparing the same area on the 1943 and 1974 editions of the USGS Clearwater 1:24,000 topographic map. Segment lengths are measured monument to monument. Records span 1943 to 2026; everything was retrieved October 4, 2026.
When was sand added near Clearwater Beach, and where did it come from?
The ledger covers every recorded sand placement from Clearwater Beach Island through Belleair Beach (R30 to R66). Sand Key projects that only touched beaches farther south, such as the 1988 to 1992 restorations at Redington Shores, Indian Rocks Beach and Indian Shores, are left out. Volumes are in cubic yards, as the agencies report them. Where a project covered more of Sand Key than the Clearwater stretch, the volume is the whole project's.
| Completed | Where (monuments) | Cubic yards | Sand source | Lead | Record |
|---|---|---|---|---|---|
| About 1949 (FDEP: "may have begun as early as 1949") | Clearwater Beach, city-owned beach property (not mapped) | about 50,000 | Pumped from the bay or harbor | City of Clearwater | FDEP SBMP 2026, p. 4 |
| 1951 | Clearwater Beach Island southwest curve (R46 to R47.5) | about 150,000 | "Offshore" (FDEP database) | Non-federal | FDEP Sand Placement Events; SBMP p. 4 |
| 1977 | Sand Key shoreline south of Clearwater Pass | not stated | Clearwater Pass channel dredging | Not stated | FDEP SBMP 2026, p. 5 |
| 1981 to mid-1984 | Sand Key (R51 to R60) | nearly 1,000,000 | Clearwater Pass | City of Clearwater (city-owned dredge) | FDEP SBMP 2026, p. 5 |
| 1994 | Sand Key Park (trucked in) | about 7,000 | Intracoastal Waterway maintenance dredging | Not stated | FDEP SBMP 2026, p. 5 |
| 1998 to Oct 1999 | Sand Key R56 to R66 and R71 to R107 | 2,612,166 (whole project) | Egmont Channel, eastern shoal | Federal shore protection project (USACE, Pinellas County) | FDEP Sand Placement Events; SBMP Table 2 |
| Aug 2006 | Sand Key R56 to R66 and R71 to R107 | 1,700,000 (whole project) | Egmont Channel, eastern shoal | Federal project | FDEP Sand Placement Events; SBMP Table 2 |
| Nov 2012 | Sand Key R56 to R66 | 600,000 (this stretch) | Offshore Borrow Area L, 12 to 15 miles west of Sand Key | Federal project | FDEP Sand Placement Events; SBMP p. 6 to 7 |
| Mar 2017 | Clearwater Pass north shore (R48 to R49) | 3,200 | Clearwater Pass | Non-federal, for two properties | FDEP Sand Placement Events; SBMP p. 5 |
| Nov 2018 | Sand Key R58 to R65.8, plus five stretches south of R71 | 1,299,858 (whole project) | Egmont shoals | Federal project (USACE) | FDEP Sand Placement Events; SBMP Table 2; USACE fact sheet |
| Feb 2022 | Clearwater Pass north shore (R49.2 to R50) | about 18,300 (11,000 dredged plus 7,300 upland) | Clearwater Pass maintenance dredging, mixed with upland sand | Not stated ("Marquesas beach improvements") | FDEP SBMP 2026, p. 5 |
| Fall 2025 (FDEP lists December 2025; county updates put the Clearwater stretch in October 2025) | Sand Key R55 to R66 and R70.9 to R109.1 | 2,057,512 (whole Sand Key placement) | Egmont shoals (FDEP); county notices also list John's Pass and Blind Pass for the wider project | Pinellas County, county-funded | FDEP SBMP Table 2; Pinellas County project page |
Since the 1951 job, Clearwater Beach Island's only mapped fills are the two small inlet projects of 2017 and 2022, about 21,500 cubic yards combined. That's roughly 1 percent of what went on Sand Key in 2025 alone. And every source is close by. Clearwater Pass sits between the two islands, Egmont Channel is the entrance to Tampa Bay, and Borrow Area L lies offshore of Sand Key itself.
The Army Corps' May 2025 fact sheet says the federal Pinellas County project (authorized in 1966, according to the county) provides for restoring 1 mile of shoreline on Clearwater Beach Island, 9.3 miles on Sand Key, 1.7 miles on Treasure Island and 1 mile on Long Key. Pinellas County lists only Sand Key, Treasure Island and Long Key as active projects, and FDEP's records show no federal sand placement on Clearwater Beach Island. Authorized on paper doesn't mean sand was ever placed.
Which land around Clearwater Beach was built from fill?
Pinellas County's coastal history notes that 20th-century dredge-and-fill work and causeway building in the back-barrier bays changed the tidal inlets along this coast. Around Clearwater Beach, the clearest result is Island Estates. We didn't find a city or county record giving its construction dates or fill volumes, so we compared the same area on two editions of the USGS Clearwater map.
| Feature | 1943 USGS map (aerial photos taken 1943) | 1974 USGS map (aerial photos taken December 1971) |
|---|---|---|
| Island Estates area | Open water with two mangrove islands, labeled Big Mangrove Key and Pasadees Key | Finger-shaped residential islands with streets labeled Island Way, Midway Island and Snug Island |
| Causeway | Labeled Clearwater Causeway | Labeled Memorial Causeway |
| Bay side of Clearwater Beach Island, south of the causeway | Short fingers of land reaching into the bay, some drawn with dashed (approximate) outlines | Longer fingers lined with streets, including Bayside Drive |
| Inlet south of the island | Labeled Little Pass | Labeled Clearwater Pass (south jetty built 1975, north jetty 1981, per FDEP) |
| Gulf beach of Clearwater Beach Island | Present, with houses along it | Present, more built up |
The two maps bracket Island Estates between the 1943 and December 1971 aerial photos, and they can't narrow it further. The finger layout, rows of lots separated by dead-end channels, is built land; tides don't make those shapes. If you're staying there, our Island Estates guide covers what's on the island today. For the wider story of how the beach town grew, see our Clearwater Beach history page.
Is Clearwater Beach sand imported from Mexico? Claims vs the record
Short version: no. The longer version, claim by claim, against the official record:
| Claim | What the record shows | Verdict |
|---|---|---|
| "Clearwater Beach sand was shipped in from Mexico." | Every Clearwater-area placement in FDEP's records names a nearby source: offshore, Clearwater Pass, the bay, Egmont Channel shoals, the Intracoastal Waterway or Borrow Area L off Sand Key. The one exception is 7,300 cubic yards of "upland" sand in 2022, with no origin given. We found no government document of foreign sand. | No record supports it |
| "Clearwater Beach is a man-made island." | FDEP and Pinellas County treat it as a barrier island, and it appears on the 1943 USGS map. | False for the island; true for Island Estates |
| "The whole beach was replaced after the 2024 hurricanes." | The county's 2025 project placed sand on Sand Key, Treasure Island and Upham Beach. Its updates place the Clearwater work on "Sand Key (Clearwater)," with closed accesses at Marina del Rey Court and Sand Key Estates Drive. | Wrong island |
| "The Army Corps paid for the 2026 renourishment." | Pinellas County paid with tourist development tax money, plus a $14.2 million state grant reimbursement, because missing easements made it ineligible for federal funds. | False |
| "Nourished sand is coarse, gray and shelly." | Florida's rule requires fill similar in color and grain size to the native beach, with limits on silt and gravel. | The rule requires a match; it doesn't guarantee one |
| "Clearwater sand stays cool underfoot." | We found no agency measurement of sand temperature here. | Unverified; wear sandals at midday |
Why is Clearwater Beach sand so white and soft?
Because it's mostly fine quartz. In a 2003 study listed by the USGS, geologists analyzed 498 seafloor sediment samples from the inner shelf off west-central Florida, which they place next to a "quartz-dominated barrier-island system." North of the entrance to Tampa Bay, quartz-rich sediment dominates the inner 15 kilometers; farther out it gives way to coarse shell sand and gravel. An earlier USGS open-file report on the same shelf found that nearshore sands north of Tampa Bay, the stretch that includes Clearwater, rarely contain more than 10 percent calcium carbonate, which is the shell component. Both studies sampled the seafloor just offshore, not the dry beach, so treat them as a description of the sediment along this coast rather than a beach sand test.
Where does the quartz come from? The 2003 study says it's probably reworked from coastal deposits laid down during Pleistocene high stands of sea level. The USGS report cites earlier work pointing to the old terrace deposits that veneer the Florida mainland. Either way, the source is Florida's own older sand, not a recent delivery from somewhere else. The shell bits are local too: mostly mollusk fragments, produced by marine life on the shelf.
Fine, clean quartz grains are pale, so a beach made mostly of them reads as white and feels soft underfoot. The shell fraction is the crushed shell you see near the waterline, and our shelling guide covers where whole shells collect. For what makes the water look clear (or not) on a given day, see our guide to Clearwater Beach water clarity.
What did the $125.7 million project cover, and what changed in May 2026?
A common version of this story says a $125.7 million renourishment finished in February 2026 on Clearwater Beach and Sand Key. Pinellas County's own records are narrower. The county commission approved a "one-time emergency beach nourishment project" on June 17, 2025, to put sand on Sand Key, Treasure Island and Upham Beach. The county described the Sand Key part as running from Clearwater Beach to Belleair Beach and from Indian Rocks Beach to North Redington Beach. Its construction updates make clear that "Clearwater" meant the City of Clearwater's stretch of Sand Key. They list "Sand Key (Clearwater)" and beach accesses at Marina del Rey Court and Sand Key Estates Drive, both south of Clearwater Pass.
| Question | Answer from the record |
|---|---|
| Who paid? | Pinellas County, from tourist development tax (hotel bed tax) money, with a $14.2 million state grant reimbursement. No federal cost share. |
| Where did sand go? | Sand Key (Clearwater, Belleair Beach, Indian Rocks Beach, Indian Shores, Redington Shores, North Redington Beach), Treasure Island (Sunshine and Sunset beaches) and Upham Beach. Not Clearwater Beach Island. |
| How much? | The county estimated more than 2.5 million cubic yards overall. FDEP records 2,057,512 cubic yards on Sand Key, R55 to R66 and R70.9 to R109.1, about 9 miles. |
| Sand source | Dredged from parts of Egmont Shoal, Blind Pass and John's Pass, according to the county's September 2025 notice (an August notice also listed Pass-a-Grille). FDEP's table lists Egmont shoals for the Sand Key placement. |
| When? | Overall schedule August 2025 to February 11, 2026. Sand went on the Clearwater stretch of Sand Key in October 2025, and dune planting finished May 21, 2026. |
| Gaps? | Yes. Where owners didn't sign temporary construction easements, the county said sand would be left off or placed only seaward of the Erosion Control Line, leaving low spots, mainly on Indian Rocks Beach, Indian Shores and Redington Shores. |
The project widened Sand Key. Clearwater Beach Island got no sand from it. If you're choosing between the two for a stay, our Sand Key vs Clearwater Beach comparison covers the differences beyond the sand. For the nourished beaches farther south, see how Clearwater compares with St. Pete Beach and Treasure Island. Our post-hurricane recovery guide tracks how the rest of the beach is doing.
Timeline of the easement standoff, with status as of October 2026
| Date | What happened | Source |
|---|---|---|
| 1966 | Congress authorizes a federal shore protection project along Pinellas County's developed Gulf shoreline | Pinellas County |
| 2015 | The county starts collecting Army Corps-compliant easements from Sand Key beachfront owners | Pinellas County |
| Nov 2018 | Last federal Sand Key nourishment (1,299,858 cu yd), built with gaps | FDEP; Pinellas County |
| 2023 | The Corps finds Treasure Island and Upham Beach also lack compliant easements and cancels their scheduled nourishment | Pinellas County |
| Fall 2024 | Hurricanes Helene and Milton erode Pinellas beaches; FDEP calls most of Sand Key "a federal beach restoration project in need of post-storm nourishment" | FDEP |
| June 17, 2025 | County approves the $125.7 million county-funded project | Pinellas County |
| Feb 11, 2026 | End of the project's construction schedule | Pinellas County |
| May 29, 2026 | County and Corps sign an amendment to their Project Cooperation Agreement: easements no longer need public-access provisions or to be permanent, and local customary-use ordinances can meet some federal cost-sharing requirements | Pinellas County |
| As of May 2026 | Only 70 percent of Sand Key project properties have signed and recorded compliant easements; the county says construction easements are still needed for 100 percent of beachfront properties | Pinellas County |
| As of October 2026 | The county's project page lists construction as completed. We found no published date for the next federal Sand Key nourishment. | Pinellas County |
The federal share has historically covered about 65 percent of project costs, according to the county, which says the new agreement "creates new avenues for securing federal dollars." The Corps' May 2025 fact sheet noted a positive Project Information Report for Sand Key after Hurricane Idalia (2023), with reports for Helene and Milton in draft.
What the 2024 storms did to Clearwater Beach Island
FDEP's post-storm report rated erosion on the island as moderate on some stretches and major on others after Helene. It shows overwash sand and a flood mark along Gulf Boulevard at R44 to R46, by Pier 60, and damaged armoring at Clearwater Pass near R47. The report says a NOAA tide gauge at Clearwater Beach peaked at +7.62 feet (NAVD). None of the recovery records we found show new sand pumped onto the island afterward. For storm planning, see our hurricane season guide.
Is nourished sand different from the natural sand?
It's meant not to be. Florida's beach construction rule, Rule 62B-41.007(2)(j), F.A.C., allows only "beach compatible fill." The rule requires that the sand be:
- mostly carbonate, quartz or similar material, with grains between 0.062 and 4.76 millimeters;
- similar in color and grain-size distribution to the native beach;
- no more than 5 percent silt or clay and no more than 5 percent fine gravel by weight;
- free of construction debris and other foreign matter, and not likely to cement the beach.
If rocks show up on a filled beach above set levels, the rule calls for removing them. Sand from maintenance dredging of navigation channels, such as Clearwater Pass, gets a looser limit of up to 10 percent fines under the same rule. All of this is a requirement, not a guarantee. We found no published side-by-side grain-size comparison for Clearwater Beach Island and Sand Key, so we can't say whether you'd notice a difference.
Sea turtles are the other concern. FDEP's beach plan says construction in the Pinellas barriers has not been restricted to outside the May 1 to October 31 nesting season. Instead, project design and construction methods are restricted to avoid or minimize harm to protected species. The county said it would work with its partners to minimize disruption to nests during the 2025 work. Our sea turtle season guide covers the nesting rules visitors need to follow.
We read Pinellas County's beach nourishment, Sand Key and 2025 project pages, its project updates and news releases from 2025 and 2026; the Army Corps' May 2025 Pinellas County fact sheet; FDEP's August 2026 Strategic Beach Management Plan, June 2026 Critically Eroded Beaches report and March 2025 Helene and Milton impact report; Rule 62B-41.007; and two USGS sediment studies of the west-central Florida shelf. We downloaded FDEP's sand placement and monument data and two USGS historical maps to build the segment map and ledger. All sources were checked October 4, 2026. We didn't sample or measure any sand ourselves. We're an independent guide, and no agency or business named here pays us.
Frequently asked questions
Is Clearwater Beach sand imported?
Not on Clearwater Beach Island's Gulf front, according to state records. FDEP maps no sand placement there apart from small fills near Clearwater Pass in 1951, 2017 and 2022, using offshore sand, Clearwater Pass sand and, in 2022, some upland sand. Sand Key, just south of the pass, is nourished with sand dredged nearby, mainly from Egmont shoals at the entrance to Tampa Bay. We found no record of sand from Mexico or anywhere abroad. If you were hoping to take a jar home, note the city rule against taking sand off the beach.
Is Clearwater Beach man-made?
No. Clearwater Beach Island is a natural barrier island, and it appears on the 1943 USGS map. Island Estates, east of the island across Mandalay Channel, is built land: open water and mangrove islands in 1943, finger islands with streets by the December 1971 aerial photos used for the 1974 USGS map.
Was Clearwater Beach renourished after the 2024 hurricanes?
Not the main beach. Pinellas County's $125.7 million project, scheduled from August 2025 to February 11, 2026, placed sand on Sand Key, including the City of Clearwater's stretch south of Clearwater Pass, plus Treasure Island and Upham Beach. Its records don't show sand going on Clearwater Beach Island.
Where does Pinellas beach nourishment sand come from?
Mostly from nearby underwater deposits. For the Clearwater-area projects, FDEP lists Egmont Channel shoals at the mouth of Tampa Bay, Clearwater Pass, an offshore area called Borrow Area L 12 to 15 miles west of Sand Key, and small amounts of Intracoastal Waterway and upland sand. The 2025 county project also drew on John's Pass and Blind Pass.
Is Sand Key sand the same as Clearwater Beach sand?
Both sit on the same quartz-dominated coast, and Florida requires nourishment sand to be similar in color and grain size to the native beach. We found no published grain-size comparison of the two beaches, so treat any claim that one is softer or whiter than the other as unverified.
Sources
- Pinellas County, Beach Nourishment and Easements (active projects, 1966 authorization, easement history, 2026 agreement terms, 70 percent easement figure as of May 2026). pinellas.gov
- Pinellas County, 2025 Pinellas County Beach Nourishment Project (locations, schedule, $125.7 million cost, $14.2 million state grant, last updated September 16, 2026). pinellas.gov
- Pinellas County, project updates for the 2025 beach nourishment project, July 2025 to May 2026. pinellas.gov
- Pinellas County news: County Commission approves beach nourishment project (June 17, 2025). pinellas.gov
- Pinellas County news: County to begin major beach nourishment project (August 22, 2025) and Pinellas County begins beach nourishment project (September 12, 2025), sand sources. pinellas.gov, pinellas.gov
- Pinellas County news: Pinellas contingent visits Washington (March 5, 2025) and Pinellas County and Army Corps of Engineers sign for beach nourishment (May 29, 2026). pinellas.gov, pinellas.gov
- Pinellas County, Sand Key Barrier Island (island extent, nourishment years) and Coastal Management Program (35 miles of beaches on 11 barrier islands). pinellas.gov, pinellas.gov
- U.S. Army Corps of Engineers, Jacksonville District, Pinellas County, FL (C) fact sheet, May 2025. saj.usace.army.mil
- FDEP, Strategic Beach Management Plan, Southwest Gulf Coast Region, August 2026 (Pinellas Barriers, pages 2 to 7 and 17 to 19). floridadep.gov
- FDEP, Critically Eroded Beaches in Florida, June 2026 (Pinellas County entries). floridadep.gov
- FDEP, 2024 Hurricane Season, Florida Southwest Gulf Coast, Hurricanes Helene and Milton Post-Storm Beach Conditions and Coastal Impact report, March 2025. floridadep.gov
- FDEP, Sand Placement Events and Coastal Range Monuments GIS layers, retrieved October 4, 2026. ca.dep.state.fl.us
- Florida Administrative Code, Rule 62B-41.007, Design and Siting Requirements (beach compatible fill). flrules.org
- USGS, Clearwater, FL 1:24,000 topographic quadrangle, 1943 edition and 1974 edition, via The National Map. 1943 (usgs.gov), 1974 (usgs.gov)
- Brooks, G.R., Doyle, L.J., Davis, R.A., DeWitt, N.T., Suthard, B.C., 2003, Patterns and controls of surface sediment distribution: West-central Florida inner shelf, Marine Geology 200. pubs.usgs.gov
- Brooks, G.R., Doyle, L.J., DeWitt, N.T., Suthard, B.C., 1999, Inner West-Central Florida Continental Shelf: Surface Sediment Characteristics and Distribution, USGS Open-File Report 98-37. pubs.usgs.gov
Picking a stretch of sand for your trip?
The natural beach and the nourished beach are a bridge apart. Our beach guides cover parking, crowds and facilities on both.
Plan your visit